WSAA engaged The CIE to understand household preferences for managing greenhouse gas emissions in the urban water industry.
There are two main sources of these emissions:
- Emissions from the coal- and gas-fired power stations that generate the electricity water utilities use to run pumps and treatment plants.
- Emissions from the process of treating wastewater. During the treatment process, friendly bacteria work to break down organic material and remove unwanted nutrients. As they do this, greenhouse gases are produced.
The first type of emissions can be reduced by improving energy efficiency and generating renewable energy. Reducing the second type of emissions is much more difficult. With current technology, some of the emissions can be captured, but not all of them. To reach ‘net zero’ emissions targets, water utilities would need to compensate for these emissions by investing in projects that reduce or capture emissions generated elsewhere. This is called carbon offsetting.
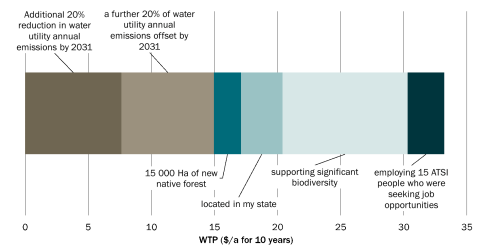
Some carbon offsetting projects have benefits additional to carbon abatement. For example, new forests may improve biodiversity and provide opportunities for recreation. Fire management projects may provide employment opportunities to Traditional Owners, protection for cultural sites, and transmission of traditional knowledge. These are called co-benefits.
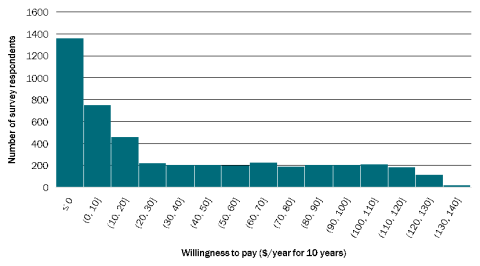
The CIE conducted a discrete choice experiment (DCE) to estimate water utility customers’ willingness to pay (WTP) for carbon offsetting and its co-benefits. A rigorous methodology was used to develop the survey instrument, including online discussion groups, in-depth interviews, and pilot surveys. The online survey was completed by a large sample of 4357 respondents from across Australia.
Estimates of WTP for offsetting emissions were very similar to estimates of WTP for reducing emissions. This finding was somewhat unexpected, given several participants in two online discussion groups conducted prior to the survey had indicated a preference for water utilities to reduce their emissions as far as possible before investing in carbon offsets. The difference in findings may be due to the small size of the sample of households participating in the discussion groups or due to the survey more clearly explaining the barriers to reducing emissions from wastewater treatment and assuring participants that offsets would be accredited, selected in consultation with customers, and subject to transparent ongoing reporting.
Respondents expressed their WTP in terms of ten annual payments for a percentage reduction in net emissions achieved by 2031. With assumptions about discount rate and timing of outcome delivery, these values can be converted to a measure of total WTP across households per tonne of CO2e reduced or offset. Under our central assumptions, the nationally-representative weighted-average WTP for emission reduction was $82 per tonne of CO2e and WTP for emission offsetting was $78 per tonne of CO2e. At the time of writing the final report (2 March 2022), the spot price for Australian Carbon Credit Units (ACCUs) was reported to be around $50 per tonne of CO2e. This month, the price fell to around $30 per tonne of CO2e. The Clean Energy Regulator paid an average of $17 per tonne of CO2e at its reverse auction in October 2021. Customer WTP at most Australian utilities is sufficient to cover the price of ACCUs at any of these recent levels.
Co-benefits are also important to households. Average WTP for one example scenario of the many that can be valued using the study results is set out in the figure below. While the levels of forest area and employment in this scenario are at the high end of the plausible range for an average-sized utility/region, the calculation shows that WTP for co-benefits is an important consideration and may be a similar order of magnitude to WTP for reduced net emissions. The offset projects delivering the greatest co-benefits appear to be environmental plantings supporting significant biodiversity.
This variation in WTP is related to the characteristics of respondents and their households. Holding other characteristics constant, WTP is higher among:
- households with higher income
- respondents aged under 30 or between 60-69
- female respondents
- households renting their dwelling, and
- respondents speaking only English at home.
These estimates were elicited in the context of zero baseline bill impacts. As with any utility investment, household support for expenditure on emission reduction and offsets would need to be verified in the context of overall pricing proposals, taking account of bill impacts from other drivers.
As with any utility investment, household support for expenditure on emission reduction and offsets would need to be verified in the context of overall pricing proposals, taking account of bill impacts from other drivers.
Details of the methodology, results, and recommendations for applying the results in cost-benefit analysis are available in the report.
For more information on the Report please contact Stuart Wilson, stuart.wilson@wsaa.asn.au